logo.gif (5830 bytes)

Compose your own report page containing any of LaPorte's graphs, customized statistical tables, paragraphs of descriptive text and your favorite pictures.

Create several reports, each with a different purpose and LaPorte will save the format to be re-used again. Apply the same report format to one or more funds or managers, for inclusion in your marketing materials or prospectus.

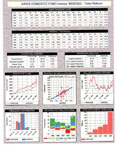
Statistics with multiple graphs
Printable Version (1200k Word DOC)
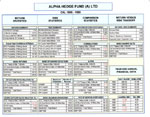
Multiple statistics versus 5 indices
Printable Version (1200k Word DOC)
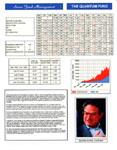
Note use of picture file
Printable Version (910k Word DOC)

 Insert any of LaPorte's graph styles
 Insert tables containing text or statistics
 Insert external picture files such as JPG or BMP files
 Employ color backgrounds or watermarks
 Resize any component and place anywhere on page
 Make calculations in table referring to other cells
 Refer to multiple investments or date ranges
 Save page layout for future use
 Change investments' names employed and rerun report
 No programming required!
 Print in black/white or color
 Export results as JPG picture files

[Home] [What's New] [About Us] [Functionality] [Database Details] [LaPorte Helps You...]
[Price List] [Download Zone] [What You Need] [Ask for It!] [Newsletter] [Contact Us] [Links]